Importance of Wellness Data Presentation

Presenting wellness data to the board of directors is crucial for several reasons. It allows the board to make informed decisions about the company's wellness programs, understand the impact of these initiatives, and align them with the overall business strategy.
Key Benefits of Effective Wellness Data Presentation
- Enhanced Decision-Making: Well-presented wellness data provides clear insights into the effectiveness of current programs, helping the board make informed decisions on future investments and strategies.
- Improved Accountability: By presenting data in a structured and easy-to-understand format, board members can hold stakeholders accountable for the outcomes of wellness initiatives.
- Enhanced Employee Engagement: When the board sees positive results from wellness programs, they are more likely to support and invest in initiatives that promote employee well-being, leading to increased engagement and productivity.
Influence on Decision-Making
For example, presenting data showing a decrease in absenteeism rates after implementing a wellness program can demonstrate the positive impact of such initiatives on employee health and productivity. This can lead the board to allocate more resources towards expanding the program or implementing similar initiatives across the organization.
Understanding Your Audience
When presenting wellness data to your board of directors, it is crucial to understand the role they play in the company and tailor your presentations to suit their preferences. Board members are responsible for overseeing the company's strategic direction, making important decisions, and ensuring the organization's overall success.
Role of the Board of Directors
- Set the company's strategic objectives and goals.
- Monitor the company's financial performance and risk management.
- Hire and evaluate the CEO and other top executives.
- Ensure compliance with regulations and ethical standards.
Tailoring Wellness Data Presentations
When presenting wellness data to the board, consider the following tips:
- Focus on high-level insights and key metrics that align with the company's goals.
- Use clear and concise visualizations such as charts, graphs, and tables to present complex data in an easy-to-understand format.
- Provide context and explanations for the data presented to help board members understand the significance and implications.
- Highlight trends, patterns, and areas of improvement to guide decision-making and strategic planning.
Data Visualization Techniques
To resonate with board members, consider using the following data visualization techniques:
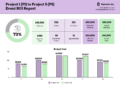
- Dashboard-style reports that provide an overview of key metrics at a glance.
- Trend analysis charts to show changes over time and identify patterns.
- Heat maps to visualize areas of strength and areas that require attention.
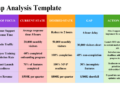
- Comparative analysis graphs to benchmark performance against industry standards or past performance.
Choosing Relevant Metrics
When presenting wellness data to your board of directors, it is crucial to choose metrics that are not only relevant but also align with the organizational goals. This ensures that the board can clearly see the impact of wellness initiatives on the overall success of the company.
Key Wellness Metrics
- Employee Engagement: Measure employee satisfaction, motivation, and overall engagement levels.
- Health Risk Assessments: Track the health risks identified in the workforce and monitor progress in reducing these risks.
- Absenteeism Rates: Monitor absenteeism trends to understand the impact of wellness programs on reducing sick days.
- Healthcare Costs: Analyze healthcare expenses related to preventable conditions and the effectiveness of wellness initiatives in reducing these costs.
Aligning Metrics with Organizational Goals
It is essential to select wellness metrics that directly tie back to the company's strategic objectives. For example, if the organization aims to improve productivity, metrics like employee engagement and absenteeism rates would be highly relevant.
Impactful Wellness Indicators
- Return on Investment (ROI):Calculate the ROI of wellness programs to demonstrate the financial benefits to the organization.
- Employee Turnover:Measure turnover rates to understand the impact of wellness initiatives on employee retention.
- Participation Rates:Track the level of employee participation in wellness activities to gauge the effectiveness of the programs.
Data Presentation Techniques

Effective presentation of wellness data is crucial when communicating with your Board of Directors. Utilizing various methods to convey information clearly can help in making informed decisions. Visuals, graphs, and charts play a significant role in presenting complex data in a concise and understandable manner.
Structuring your data presentations for maximum impact is key to ensuring that the message is effectively communicated.
Utilizing Visuals, Graphs, and Charts
When presenting wellness data to your Board of Directors, incorporating visuals such as graphs and charts can enhance the understanding of complex information. Visual representations can help in identifying trends, patterns, and correlations within the data. Utilize graphs to showcase changes over time, pie charts to represent proportions, and bar charts to compare different data points.
Including visuals can make the data more engaging and easier to interpret.
Structuring Data Presentations
To maximize the impact of your data presentations, consider structuring the information in a logical and organized manner. Start with a clear agenda outlining the key points you will cover. Present the data in a systematic way, focusing on the most important metrics first.
Use headings, subheadings, and bullet points to break down the information into digestible chunks. Remember to highlight the key takeaways and recommendations based on the data presented. By structuring your data presentations effectively, you can ensure that the message is communicated clearly and concisely.
Ensuring Data Accuracy and Consistency
When presenting wellness data to your Board of Directors, it is crucial to ensure the accuracy and consistency of the information being shared. Inaccurate data can lead to misguided decisions, while inconsistent reporting can create confusion and mistrust among stakeholders.
Here are some strategies to help maintain data accuracy and consistency:
Importance of Data Accuracy
Ensuring data accuracy is essential to provide a clear and reliable picture of the organization's wellness initiatives. Inaccurate data can lead to incorrect conclusions and misguided strategies. To maintain data accuracy, it is important to establish robust data collection processes, validate the sources of information, and regularly audit the data for errors.
Strategies for Maintaining Consistency
- Establish clear guidelines: Define standardized protocols for data collection, analysis, and reporting to ensure consistency across all wellness metrics.
- Train staff: Provide training to employees responsible for collecting and reporting wellness data to ensure they understand the importance of consistency and adhere to established guidelines.
- Utilize technology: Implement data management systems and tools that can automate data collection processes and reduce the likelihood of human error.
Best Practices for Verifying Reliability
Regularly cross-check data: Compare data from multiple sources to identify any discrepancies and ensure the reliability of the information being presented.
Engage experts: Consult with data analysts or wellness professionals to validate the accuracy of the metrics and ensure they are relevant to the organization's goals.
Conduct internal audits: Periodically review the data collection processes and reports to identify any inconsistencies or inaccuracies that need to be addressed.
Clarifying Questions
Why is presenting wellness data to the board of directors crucial?
Effectively presenting wellness data to your board of directors can lead to informed decision-making and proactive measures to improve employee well-being and organizational performance.
How can I tailor wellness data presentations to suit the board's preferences?
Tailoring wellness data presentations involves understanding the board's level of expertise, focusing on key metrics that align with their interests, and using visual aids for clarity.
What are some examples of specific wellness indicators that are impactful for board discussions?
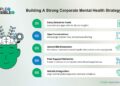
Examples of impactful wellness indicators for board discussions include employee absenteeism rates, mental health program participation numbers, and overall workforce productivity metrics.


